
Numbers that hold up under scrutiny
Every campaign we manage produces a report you can read without a decoder ring. Below are real client outcomes — CTR lifts, cost-per-lead drops, and revenue gains — unchanged.
61%
4.8×
38%
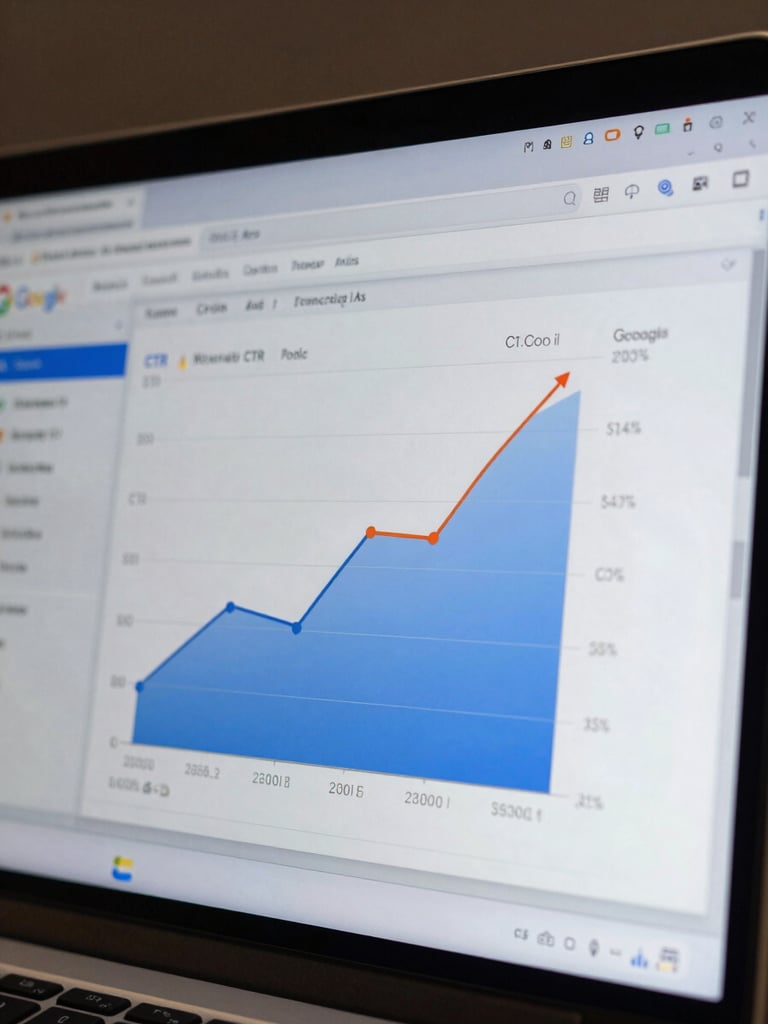
Average CTR improvement within 60 days of campaign restructure and keyword overhaul.
Average reduction in cost-per-lead across managed accounts in the first 90 days.
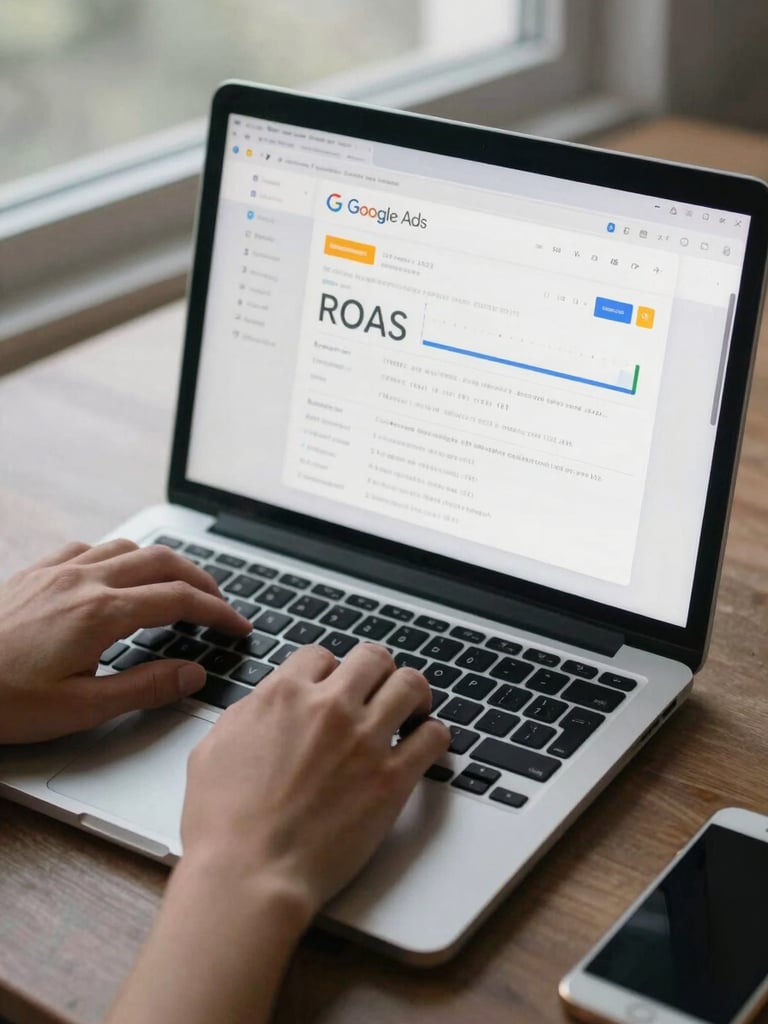
Median return on ad spend achieved across Search and Performance Max campaigns.


Three accounts. Three verticals. Same rigor.
HVAC contractor: 71% lower cost per booked call
Before: $148 cost-per-lead, broad match keywords hemorrhaging budget on irrelevant queries. After 60-day restructure — tight phrase match, negative keyword expansion, dedicated landing pages — CPL dropped to $43.
Conversion tracking was broken on intake. We fixed it on day one — the client had been flying blind for six months without knowing.
Apparel brand: 5.2× ROAS on Performance Max
Previous agency ran a single catch-all Shopping campaign. We segmented by margin tier, rebuilt the product feed, and layered audience signals. ROAS climbed from 1.8× to 5.2× in 90 days.
Monthly reporting showed every SKU's contribution margin alongside ad cost — the client cut two low-margin lines that were eating 22% of budget.
SaaS platform: 44% more qualified demo requests
The client was generating clicks but demos weren't closing. We introduced RLSA layers, tightened ad copy to filter out SMB traffic, and added a dedicated demo landing page. Qualified pipeline rose 44% in 45 days.
Weekly check-ins included a live screen share of the campaign — no summary emails, no filtered dashboards.
What clients say after seeing the reports
They sent us a report on day three — before we even asked. Every line item had a plain-English explanation. That's not what we were used to.
CPL cut in half. I've heard that pitch before. This time I watched it happen in the account, week by week, with full access to the data.
We'd burned through two agencies. NK Infotech IT called us the morning after onboarding with three specific things they were fixing. No fluff.
Marcus T. — Operations Director, Home Services Group
Priya S. — Founder, E-Commerce Apparel Brand
Daniel R. — VP Marketing, B2B SaaS Platform
Your numbers should look like these
Request a free Google Ads audit and we'll show you exactly where your current spend is going — and where it should be going instead.